

Using statistics for truly understanding psychological processes
In 1892 Gerard Heymans founded the Psychological Institute in Groningen and, with that, empirical psychology in the Netherlands. By conducting experiments in his laboratory, he gained valuable insights into a wide range of psychological problems. Over a century later, we teach our students essentially the same approach for empirical research: develop a test or a questionnaire, randomly assign your “random sample” (read: fellow students) into treatment groups, let them take the test or complete the questionnaire, and perform adequate statistical analyses. Sometimes a follow-up measurement several months later is performed to study the longer-term effects of treatment.
All this is extremely useful in finding inter-invididual patterns: differences between (groups of) persons. However, these methods are not helpful when you are interested in intra-individual patterns: differences (over time) within a single person.
Why would you want to study intra-individual patterns? Suppose you are interested in (long-term patterns in) Positive Affect (PA) and study two persons, Red and Blue. You measure their PA scores on day 1 and a few days and 1, 2, and 3 months later. The first plot below, based on virtual data, shows that their PA scores at these respective time points (indicated by the dots) are very similar: in your sample you did not find evidence that Red and Blue behave differently with respect to PA. Further, the measured PA scores are fairly stable; there are no steep increases or decreases in scores.
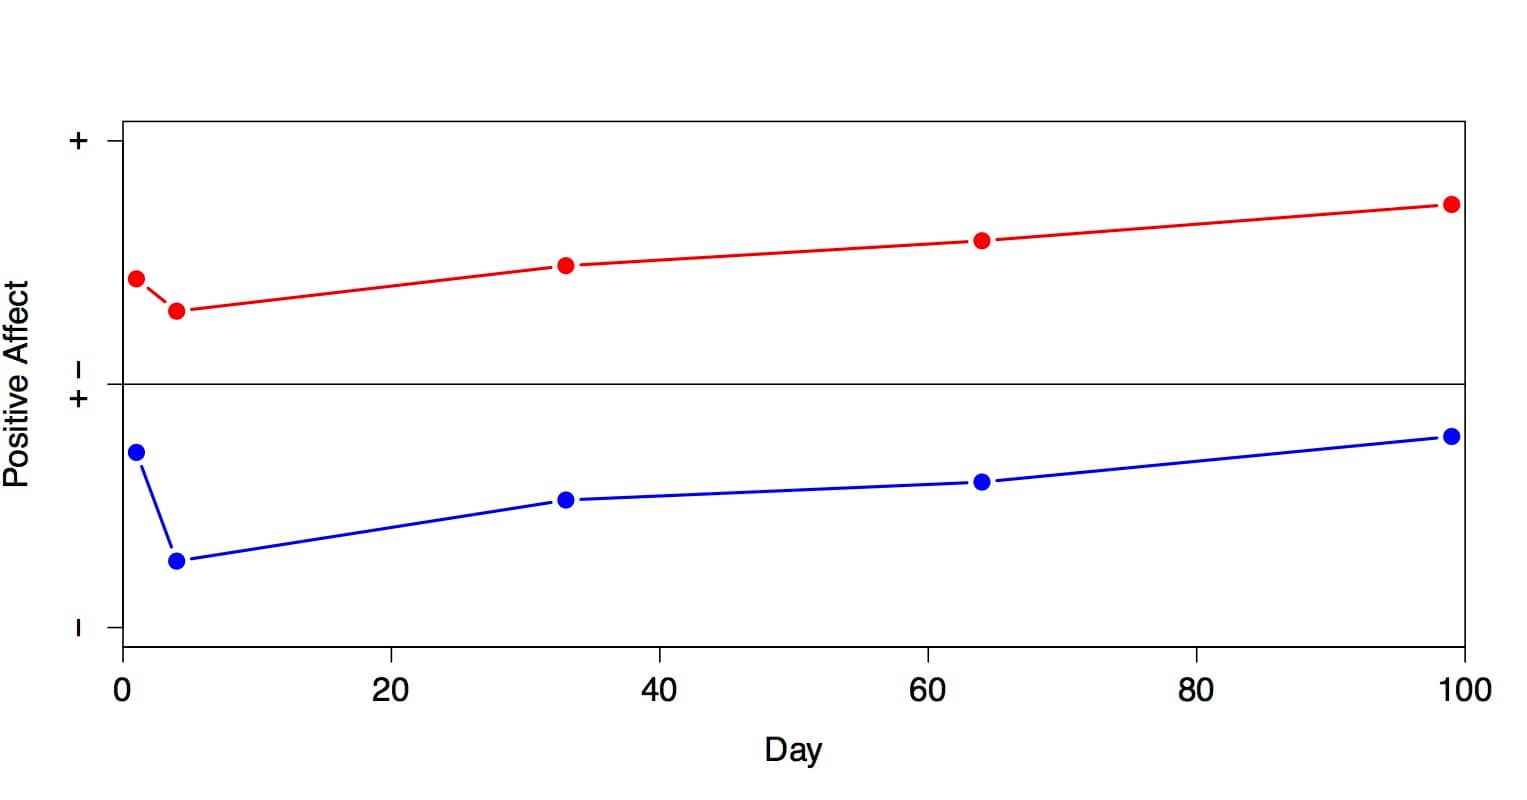
Plot 1: Both subjects are measured just five times in a 100-day-period and their data look very similar (virtual data).
However, suppose you didn’t measure Red and Blue just five times, but daily for a 100-day period. Now it is clear, from the second plot, that Red and Blue are actually quite different. For (nearly) every day, Red’s PA score is quite similar to the day before, whereas for Blue, a positive day is usually followed by a negative day and vice versa. The extent to which two subsequent days are similar is called inertia. It is known that inertia in PA is related to a wide range of psychological traits, such as depression, neuroticism, and rumination. Thus, based on the inertia-differences between Red and Blue, psychologists might infer something about their personalities.
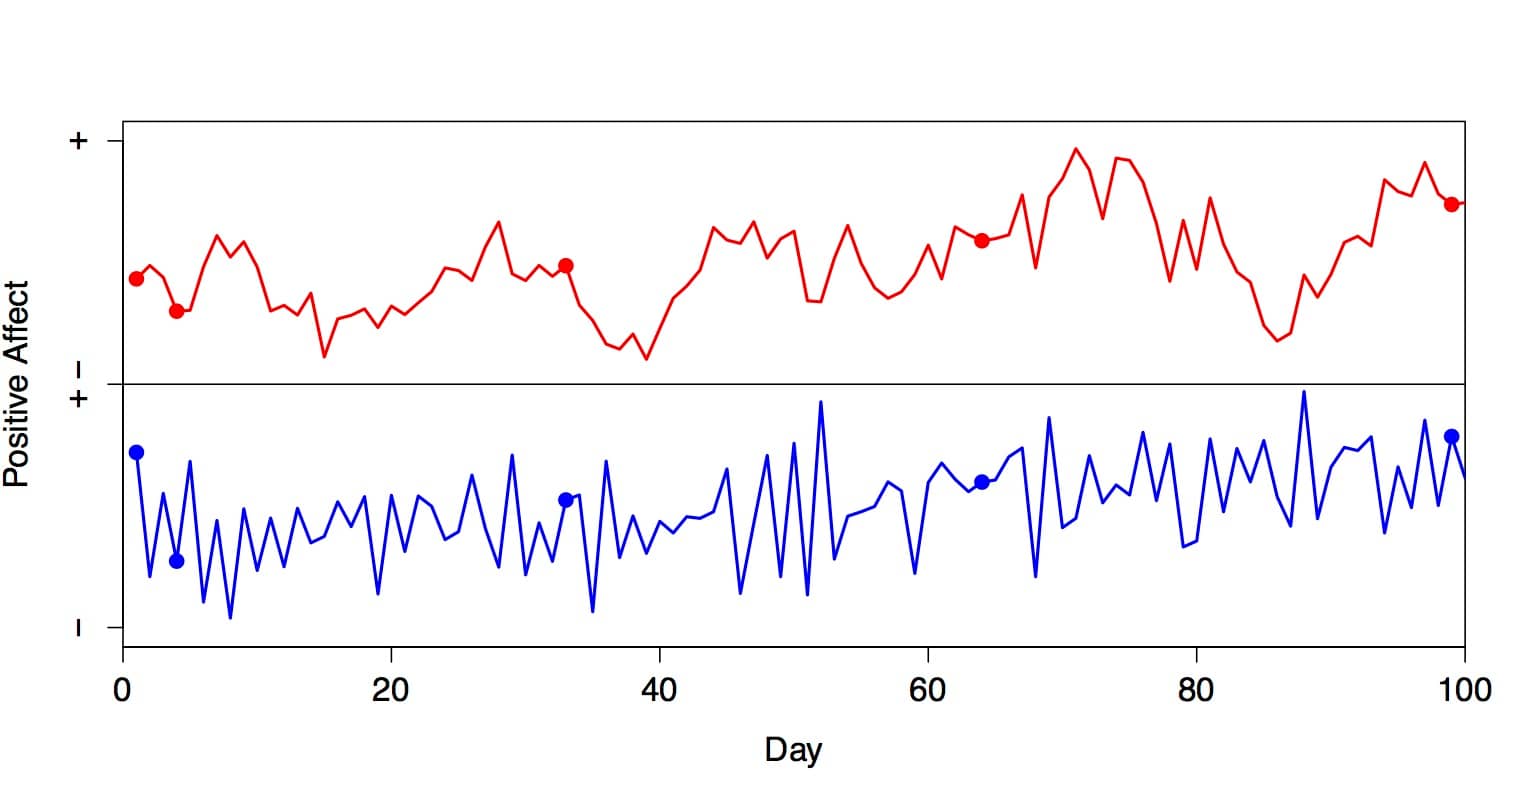
Plot 2: Now that same subjects as in Plot 1 are measured a hundred times in a 100-day-period, their data look quite different (virtual data).
Static psychological experiments are useful for understanding between-person differences in psychological outcomes. Measurement-intensive longitudinal studies such as above are essential for understanding within-person psychological processes. Up to a decade or two ago, it was very difficult to conduct such studies: you can’t expect your study participants to go to the basement of the Heymans building 100 days in a row, to complete a questionnaire. Thanks to advances in computing and Internet technology, however, nowadays you can measure variables highly intensively with relatively little effort: answering a short online questionnaire is easy, and applying smart apps to automatically measure how much people walk, sleep, or consume electricity is even easier.
When collecting these non-conventional type of data, you also need a non-conventional method for analysing them. The Bayesian Dynamic Linear Model (DLM) is extremely suitable here. This model can be used to both accurately estimate parameters of longitudinal data and accurately forecast the value(s) of the next measurement(s). The DLM gained popularity after Mike West and Jeff Harrison published a book on it in 1989, but it was mainly applied in economics and biology. Applying the DLM in psychology has been rare up till now.
The above example about Red and Blue is obviously an oversimplification of the type of data the modern psychologist might consider. More realistic examples would include some of the following ingredients: multiple dependent variables (e.g. both Positive and Negative Affect); multiple predictors (age, gender, personality scores); latent variables (i.e. variables that cannot be observed directly); many more than two persons in a possibly hierarchical setting (such as a multilevel model); strange patterns of missing data (due to non-response, drop-out, faulty apps, etc.), sudden changes in measurement due to therapeutic intervention, etc. In the past decades, there have been many additions to the theory of DLM that accommodate its use in these types of situation. The DLM is comparable to a box of LEGO bricks: once you know how it works, you can build whatever you like.
Thanks to two grants from NWO, our research group is now extending the DLM for application into psychological practice, with promising results so far.


Casper, you convinced me that these five measurements simply are not enough; but now you speak of “truly understanding psychological processes”. If you took, say, ten samples a day, yielding 1000 data points in total instead of the 100 shown on Plot 2, the comparison between the subjects might yet look different, might it not? Or if you had, by chance, measured them at a different time on each day.
So how do you know what the “true” psychological process is and when do you know that you understood it?
A very good remark – I should have given this a bit more detail. Indeed, you don’t know if 100 points are sufficient either. Maybe 100 times a day isn’t – and maybe even monitoring someone 24 hours a day will not reveal Truth, because by observing you can influence what you are measuring. Heisenberg’s uncertainty principle is not restricted to physical processes: people are showing their best behaviour if they know they are watched.
In practice, you of course already know a lot of aspects of what you are studying. When studying emotions, it is well known that there’s something like a daily cycle in Positive and Negative Affect. By knowing this, you can either ‘filter out’ this informating by measuring every day at the same time, or including some seasonal regression term in your model and thus incorporating it into your model. In emotion research, having one or two measurements a day already tells you a lot about the mid-term and long-term processes, but indeed, it doesn’t tell you much about the short-term processes. It depends on your research question (are you interested in short or long term processes), which measurement design is best suited. (More measurements is always better, from a statistical point of view.)