

How to become a “total genius”
There are lots of tests online nowadays. When I’m scrolling through my Facebook timeline, I see many Buzzfeed tests coming by that allow me to test which Disney Animal I am, what the names of my future babies will be based on my fast-food preferences, in which Hogwarts House I belong, and what my level of intelligence is.
The results of these tests are, of course, for “entertainment only.” If you want a proper assessment, you will have to take a proper test. (We all know that you need the Sorting Hat on the Pottermore website to see in which House you belong.) Indeed, scientists put a lot of effort into creating proper intelligence tests. That’s because it is rather difficult to create an intelligence test that reliably predicts outcomes.
A lot of expert knowledge and research is required to set up an intelligence test. The interpretation of the results is not straightforward either. But it seems easy.
Based on the number of items correct, you conclude how intelligent you are. For instance, in the 20-question Buzzfeed intelligence test, you can be “mediocrely intelligent” (0 to 6 points), “quite intelligent” (7 to 12 points), “very intelligent” (13 to 17 points), or a “total genius” (18 to 20 points). It’s good for your self-esteem to learn that you are a total genius, of course, but unfortunately those results were just arbitrarily made up by someone. (It is not even possible to get a “below average” result!)
In a proper intelligence test, the result – often expressed as an IQ score – is based on a comparison of your test scores to those of other test-takers. The downside of a proper test is that the conclusion “total genius” is way less likely, but the upside is that the result actually means something. Here, I will explain how IQ scores are created and, in doing so, I will also explain how you can take advantage of the process to make yourself a “total genius.”
Performance relative to others
IQ scores express intelligence relative to the performance of others. Ideally, we compare the test scores of the test-takers to the scores of everyone for which the test was created (e.g., Dutch people between 10 and 60 years old). But unfortunately it is not possible, nor practical, to test everyone in this population. That is why a large group of people – called a “normative sample” – completes the test during the test construction phase.
It is important that this normative sample consists of people with the same characteristics as the population in as many ways as possible. For instance: sex, age, religion, and education level. This is because the choice of reference population affects the conclusions drawn from the comparison.
If only people with high levels of education are included in the sample, the resulting norms will be too high. Test-takers will then test lower than their “real” intelligence.
This representativeness of the normative sample for the population is not important for all tests. In clinical tests, for instance, you typically want to compare your test score with the test score of a healthy version of yourself. Because your “healthy score” may not always be known, however, your score is instead compared with the scores of a large group of healthy people who are as similar to you as possible. Rather than being representative for the population (e.g., 49.9% females and 50.1% males), the reference group needs to be similar to the test-taker (e.g., 29-year-old, highly-educated males).
Intelligence tests, by contrast, are typically used for selection purposes (e.g., job or entrance to an educational program). In these cases, a person should not be compared to people who are very similar, but to people in the broader population.
Typically, in intelligence tests, your score is compared to scores of people of the same age. After all, we know that performance changes with age and that it is therefore unfair to compare the score of a 5-year-old with the score of a 40-year-old. (They also don’t ever compete in the real world, so such a comparison isn’t really about “intelligence.”)
Norm calculation
If the results of intelligence tests rely on norms, then how are those norms determined? Figure 1 shows hypothetical intelligence test scores for 10 to 60-year-olds. In the range 10 to 25-year-olds, the mean test score increases with age. After that, the mean test score stays about the same for increasing age. Here, we want to interpret the test score given someone’s age.
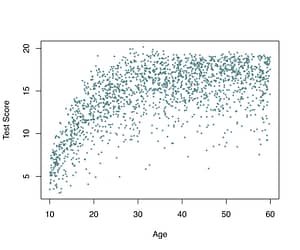
Figure 1. Plot of intelligence test scores for 10- to 60-year-olds
In a nutshell, the goal is to estimate the distribution of scores in the population for each age value. To see the distribution of scores for a given age in the sample, imagine a vertical line for a particular age-value and look at the distribution of points on that line. You might notice that for some age-values, only a limited number of points are present in the sample. Some age-values do not even occur in the sample. We will use the data from the sample to estimate how the distribution will look like in the population for every age-value.
Traditionally, norms were created for subgroups by age. For example, for age ranges of 10 years (10-19, 20-29…, 50-59). This is illustrated for the hypothetical data in Figure 2. The test scores of all people within each age group were used to estimate the distribution of that age group. The horizontal lines are the median test scores within each age group, which means that 50% of the people within that age group obtained that test score or lower.
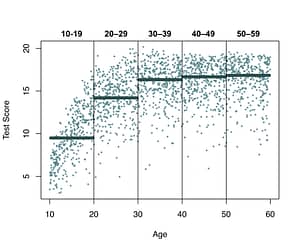
Figure 2. Plot of intelligence test scores for age groups, as in traditional norming. The horizontal lines represent the median test scores.
This method is problematic for two reasons. First, it is assumed that the score distribution is the same for all age values within this age range. (We have already seen that this is not true as the test score increases with age.) Second, if people take the test one day before their 20th birthday and take the test again one day later, the estimated IQ will change a lot because they are in a different age group. This problem can be solved by making the age groups smaller, but this also makes the number of test scores within each group smaller. This then makes it even harder to estimate the score distribution within each group.
These problems are solved through continuous norming, where all age-values are used to estimate the raw score distribution. As the name already gives away, age is used as a continuous predictor. So, basically, we make a regression model with age as predictor and the raw test score as the outcome variable. In this model, we estimate the characteristics of the distribution as a function of age.
Often, it is assumed that this distribution for each age-value follows the bell-shaped normal distribution, but this is hardly ever the case in practice. For example, the distribution can be asymmetric due to ceiling effects. Together with my PhD supervisors prof. Marieke Timmerman and prof. Casper Albers, I study sophisticated statistical methods for norm calculation that do not impose that unrealistic assumption of normality.
IQ scores
So how do we get from this score distribution (given age) to normed scores? A normed score type that makes it easy to interpret scores relative to other scores is the percentile, which tells you the percentage of people having the same test score or lower. For example, if your percentile is 78.6, this means that 78.6% of the people in the population of your age obtained the same score or lower.
Figure 3 again shows the hypothetical test scores, but this time with estimated percentile curves. As example, we look at 26.7-year-olds, which are indicated by the vertical line. The curved black line shows the median values for every age value. Of all 26.7-year-olds in the population, 50 percent has test score 15.6 or below. The boundaries of the curves in three shades of grey illustrate the 5th, 15th, 25th, 75th, 85th, and 95th percentiles.
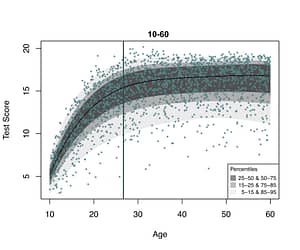
Figure 3. Percentile curves as a function of age and the normative data in blue. The vertical line represents 26.7-year-olds.
It is clear from these curves that the distribution given age is non-normal. For example, for 26.7-year-olds, the score distribution is left-skewed: the distance between the 5th and 25th percentiles is larger than the distance between the 75th and 95th percentiles. In other words, the tail on the left side of the distribution is larger than the tail on the right side.
Besides this skewness, we see that the width of the distribution also varies with age. For example, the test score distribution is smaller for 10-year-olds than for 40-year-olds.
Why are those curves important? They allow us to calculate norms precisely for every combination of test score and age. Of course, it is possible to add other personal characteristics, like sex and education level. Percentiles can also easily be transformed into IQ scores. For example, the 50th percentile corresponds to an IQ score of 100, and the 84.1th percentile corresponds to an IQ score of 115. An IQ score of 115 tells you that you scored one standard deviation above the mean, compared to people of your age. It also means that about 84.1% of the people of your age had the same score or lower.
Although it is not clear what the exact definition of a “total genius” is, it is clear that very few people obtain a very high IQ score. (For instance, IQ scores above 145 are only achieved by about 0.13% of the population.) Fortunately, there is a way everyone can easily obtain the label “total genius.” You can retake the Buzzfeed intelligence test a couple of times. Or you can use 2-year-olds as your reference group in norming the results: compared to them, you are very smart indeed!