
To p, or not to p
In Psychology, inferential statistics are predominantly conducted through means of the Null Hypothesis Significance Test (NHST). In NHST, statistical evidence is often communicated with the so called p-value. P-values are used to indicate the probability of obtaining a data pattern at least as extreme as the one that was observed, given that the null hypothesis is true.
Let us say, for example, that we are interested in relieving the symptoms of depression. We experimentally compare the effects of a new medication to the effects of a placebo on relieving these symptoms. We find that people in the medicated group have fewer symptoms than people in the placebo group. The between-group difference in this sample is associated with a p-value of .12.
This means that if the new medication is just as effective as the placebo (not better), then the probability of observing the difference between the new medicine and the placebo — or a difference even more extreme — is 12%. By convention, this is taken to be insufficient to disprove the null hypothesis. And thus, by convention, we “fail to reject” the null hypothesis: we do not find evidence to reject the notion that the new medication is just as effective as the placebo.
A low p-value, typically below .05, is considered “statistically significant”. Such a finding can then be interpreted as evidence against the null hypothesis: the difference is large enough that it was very unlikely to have been produced by chance. Unfortunately, p-values are plagued by a series of problems (e.g., Wagenmakers, 2007, van Ravenzwaaij & Ioannidis, 2017). Below, I list what I consider to be the four most pertinent.
Problem 1.
Using p-values, researchers are not able to quantify evidence in favor of the null hypothesis. This is because a non-significant p-value (by convention, any p>.05) can be the result either of evidence in favor of the null hypothesis, or the result of a lack of statistical power (that is, if we had collected more data, the results of our inference would have been statistically significant).
Clinically, it is important to be able to quantify evidence in favor of the null hypothesis: this treatment is good for that problem. But there is an equally important, albeit different, interest in research. To wit: the same experiment might be carried out by twenty different labs, with the one “lucky” one concluding—by chance—that there actually is an effect. Relying solely on p-values then allows the random accident to be treated as true knowledge, with potentially harmful consequences.
Problem 2.
P-values lead to over-rejecting the null hypothesis. The underlying statistical problem is that evidence is a relative concept, and only considering the probability of the data under the null hypothesis leads to biases in decision making. When this null is the presumption of innocence, people go to jail who should not.
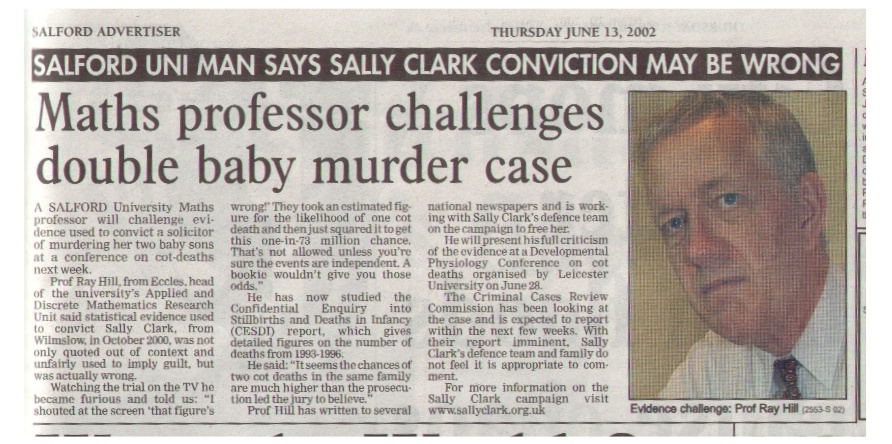
Consider, for instance, the case of Sally Clark, a British solicitor whose two sons died, in separate incidents, in their infancy. She was prosecuted for and initially convicted of their murder. The argument for her guilt was statistical: the likelihood of two infants in a row dying of Sudden Infant Death Syndrome was calculated to be extremely low (about 1 in 73 million, or p < .001). So the null hypothesis was rejected with great confidence. Should it have been?
The prosecution’s statistical expert had not taken into account the probability of the data under an alternative hypothesis: A mother is very unlikely to murder her two infant children. Subsequent calculations then showed this second probability to be even less likely than the former (by a factor of 4.5 to 9; see Hill, 2004 for details).
Clark’s original conviction was overturned, and the expert disgraced, but only after she had already spent four years in prison. She then later died of alcohol poisoning. In reporting on her death, The Guardian quoted a statement from her family: “Having suffered what was acknowledged by the court of appeal to be one of the worst miscarriages of justice in recent years… she was never able to return to being the happy, kind and generous person we all knew and loved.”
In other words, over-reliance on the improbability of one piece of evidence is not merely a problem for researchers. It has real-world implications.
Problem 3.
P-values produce results that are not intuitive to interpret. Researchers generally want to use the data to infer something about their hypotheses, such as: What evidence do the data provide for the null hypothesis versus the alternative hypothesis? The p-value cannot answer questions like this. They can only give an abstract number that quantifies the probability of obtaining a data pattern “at least as extreme” as the one observed if the null hypothesis were true. This definition proves to be so cryptic that most researchers in the social sciences interpret p-values incorrectly (e.g., Gigerenzer, 2004; Hoekstra et al, 2014, see also link).
Problem 4.
P-values do not allow for optional stopping, based on examining the preliminary evidence. This means that a p-value can only be properly interpreted when the sample size for testing was determined beforehand and the statistical inference was carried out on the data of that exact sample size. In practice, additional participants are often tested when “the p-value approaches significance”, after which the p-value is calculated again.
In clinical trials, this problem takes the form of interim analyses with the potential of early stopping at different points (Mueller, Montori, Bassler, Koenig, & Guyatt, 2007). Alternatively, sometimes testing is discontinued when “an intermediate analysis fails to show a trend in the right direction”. These practices produce a bias against the null hypothesis: if researchers retest often enough, they are guaranteed to obtain a statistically significant result even if in reality the null hypothesis is true!
So if p-values are so riddled with problems, why is it that we get taught about p-values from our first year statistics courses on?
- Existing text books on statistics for the social sciences explain the state-of-the-art in statistics from two or three decades ago. The reason for this is simple, text books are written by relatively seasoned researchers who have not had the privilege of learning about what are currently state-of-the-art statistical techniques in their own undergraduate degree. As a result, statistical text books are a little “behind the times”.
- Because of the unrepresentative textbook issue, it is difficult to get exposed to different (and better) ways of conducting statistical inference. I myself only learned of these techniques as a PhD-student: there was no room for it in my undergraduate curriculum.
- Finally, the best alternative (Bayesian hypothesis testing, which was used to get Sally Clark acquitted) requires computational power that has not been available on our computers until relatively recently. As a result, better alternatives may have existed in the past, but were never really feasible!
So, what is this Bayesian hypothesis testing, how does it work? Bayesian hypothesis testing quantifies evidence of two competing hypotheses relative to one another by means of a Bayes Factor (e.g., Kass & Raftery, 1995). The Bayes Factor provides an attractive alternative to each of the four problems I listed above. In a follow-up post, I shall tell you all about it!
Relevant Publications
Gigerenzer, G. (2004). Mindless statistics. The Journal of Socio-Economics, 33, 587-606.
Hill, R. (2004). Multiple sudden infant deaths – coincidence or beyond coincidence? Paediatric and Perinatal Epidemiology, 18, 320-326.
Kass, R. E., & Raftery, A. E. (1995). Bayes factors. Journal of the American Statistical Association, 90, 773- 795.
Hoekstra, R., Morey, R. D., Rouder, J. N., & Wagenmakers, E.-J. (2014). Robust misinterpretation of confidence intervals. Psychonomic Bulletin & Review, 21, 1157-1164.
van Ravenzwaaij, D. & Ioannidis, J. P. A. (2017). A Simulation Study of the Strength of Evidence in the Endorsement of Medications Based on Two Trials with Statistically Significant Results. PLoS ONE 12: e0173184.
Wagenmakers, E.-J. (2007). A practical solution to the pervasive problems of p values. Psychonomic Bulletin & Review, 14, 779-804.
Don van Ravenzwaaij is a lecturer (Assistant Professor) at the Psychometrics and Statistics Department of Psychology at the University of Groningen. His research interests can roughly be divided in two main strands:
The first pillar of his research has been the advancement and application of response time models to speeded decision making. This work involves both theoretical and applied work in the fields of mathematical psychology, statistics, neurophysiology, intelligence research, social psychology, psychopharmacology, and clinical psychology. Two of his papers in which response time models were applied to the Implicit Association Test and Video Game data have made it to the popular media (see link to Psychology Today article and to APA PeePs article).
The second pillar is about proper use of statistical inference in science. This work includes, but is not limited to, advocating preregistration of experiments, conducting replications, developing the statistics to test replications, promoting the use of Bayesian statistics, and developing flexible decision criteria in statistical inference.
Select Publications
- van Ravenzwaaij, D. & Ioannidis, J. P. A. (2017). A Simulation Study of the Strength of Evidence in the Endorsement of Medications Based on Two Trials with Statistically Significant Results. PLoS ONE 12: e0173184. R code for the simulations can be found here. Supplementary material can be found here.
- van Ravenzwaaij, D., Brown, S. D., Marley, A. A. J., & Heathcote, A. (2016). Accumulating Advantages: A New Approach to Multialternative Forced Choice Tasks. Manuscript submitted for publication. Supplementary material can be found here.
- Field, S. M., Wagenmakers, E.–J., Newell, B. R., Zeelenberg, R. & van Ravenzwaaij, D. (2016). Two Bayesian Tests of the GLOMOsys Model. Journal of Experimental Psychology: General, 145, e81-e95.
- van Ravenzwaaij, D., Boekel, W., Forstmann, B. U., Ratcliff, R., & Wagenmakers, E.–J. (2014). Action Video Games Do Not Improve the Speed of Information Processing in Simple Perceptual Tasks. Journal of Experimental Psychology: General, 143, 1794–1805. The online appendix can be found here. The data from both experiments can be found here. This article was featured in an issue of APA PeePs here.