

The Problem With Statistics
It was about 20 years ago that I took a statistics course at the University of Groningen. I passed, but only just. Scribbled on my exam answers was the professor’s feedback: “hakken over sloot” (narrowest of margins). At the time, I was happy to have the course over and done with – after all, isn’t statistics just about the most intellectually uninspiring topic imaginable? As most other statistics courses, this one offered the student a cookbook approach to data analysis: if the data are normally distributed, use an ANOVA; if the data are frequencies, use a chi-square test; if you want to learn about the precision of your measurement, compute a confidence interval. Yawn.
“the way statistics is taught in our universities is generally a depressing failure”
Now, after 20 years of reflection and half a career in Psychological Methods, I realize that back then my feelings about statistics were … exactly right. The way statistics is taught in our universities is generally a depressing failure. Why? One reason is that after completing all those statistics courses, students can indeed compute certain quantities (a p-value, a confidence interval) but they have no clue what those quantities mean. Perhaps this is because the interpretation of key statistical concepts is rather counter-intuitive.
For instance, suppose we wish to quantify the precision of measurement for a particular variable, and we compute that a 95% confidence interval ranges from 0.1 to 0.4. This means –pay attention now, this is important!– that if we were to use this same procedure for other (imaginary) data sets, 95% of the intervals capture the true value. So a 95% confidence interval includes the true value in 95% of imaginary data sets (i.e., data sets that could be observed if new samples were to be drawn from the population). Unfortunately, what this means for a particular data set is entirely unclear. We definitely may not conclude that there is a 95% probability that, for the present data set, the true value is in between 0.1 and 0.4.
To drive this point home, consider an admittedly extreme example. You measure people’s weight with a scale that returns the correct value 95% of the time; in the remaining 5%, the scale malfunctions and returns the value ‘1 kilo’. A perfectly valid 95% confidence procedure is simply to report the value that the scale returns. But this is silly – when the scale returns ‘1 kilo’ we know we have learned nothing at all about that person’s weight, and when the scale returns any other value we can be 100% confident in the result (because we know this value to be correct). Averaging over these outcomes and reporting ‘95%’ is meaningless and misleading.
As an aside, the statistical procedure that provides such meaningless and misleading results is also known as “frequentist” or “classical”. For historical reasons, it is the dominant statistical paradigm in the behavioral and social sciences. Often it is the only statistics that students are taught. The alternative statistical procedure is known as “Bayesian” (after its inventor, Thomas Bayes). Researchers who use Bayesian statistics do not provide silly confidence intervals; Bayesian conclusions always depend completely on the observed data (for details see Berger & Wolpert, 1988; Wagenmakers, 2007).
At any rate, many psychologists have advertised the use of classical confidence intervals (e.g., Cumming, 2014). But do researchers actually understand what a confidence interval is? Rink Hoekstra, Richard Morey, Jeff Rouder, and I decided to put this to the test. We developed a questionnaire with six true/false questions about confidence intervals, and we administered this questionnaire to 120 academic psychologists and 442 first-year psychology students. The students had no previous experience with statistics. If you know anything about statistics, you might want to answer the questions yourself before I tell you what happened. Here is the questionnaire:
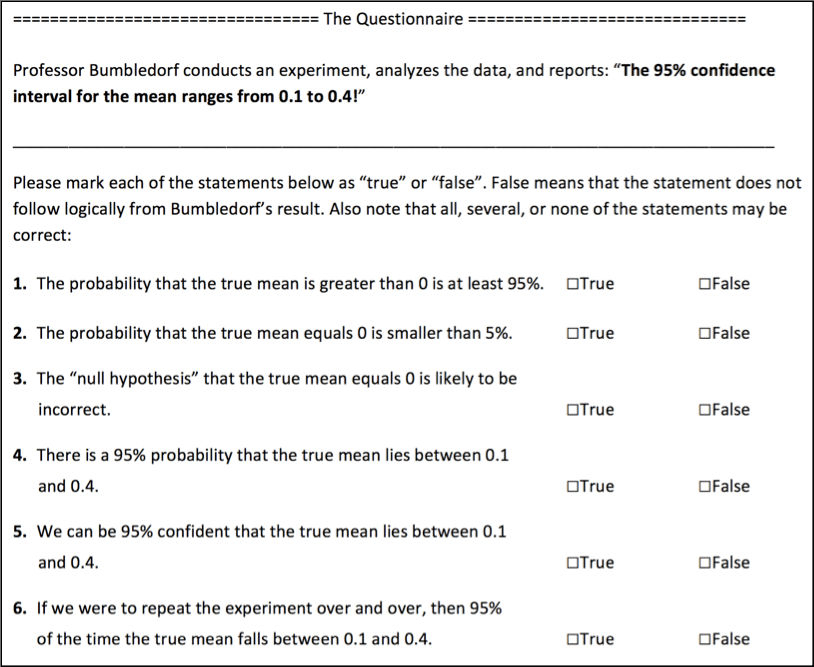
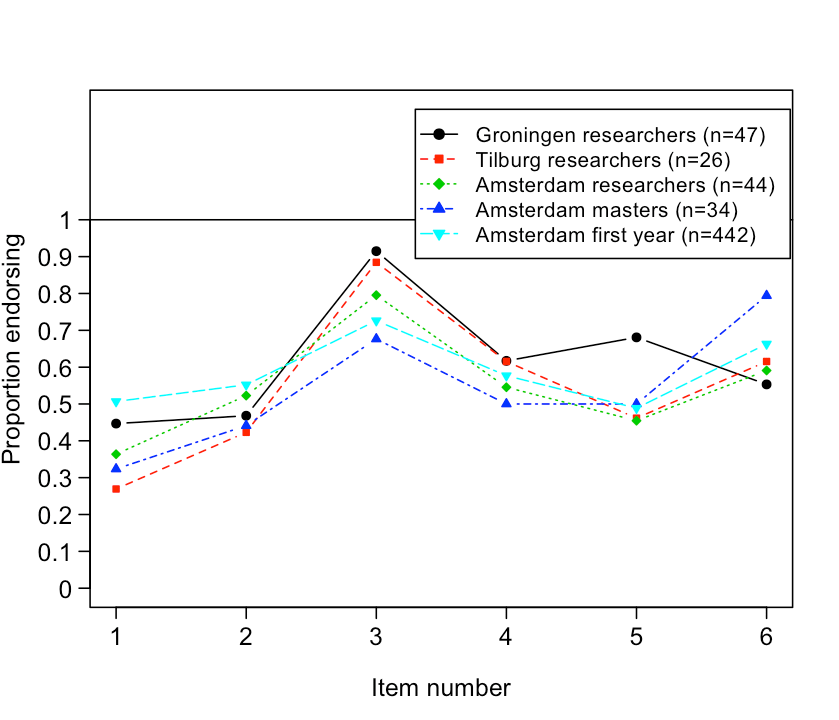
The correct answer is that all six statements are false and none should be endorsed. Statement 6 comes close but mistakenly mentions the specific values of 0.1 and 0.4. Thus, the correct statement is “If we were to repeat the experiment over and over, then the 95% confidence interval captures the true mean 95% of the time”. Hoekstra et al. (in press) provide a more detailed explanation. As expected, both researchers and students did poorly, incorrectly endorsing an average of over three statements. To our surprise, researchers failed to outperform the students. The data are visualized below; on the y-axis, “proportion endorsing” refers to the proportion of participants that endorsed a certain item, separately for each expert group. For instance, about 90% of Groningen researchers endorsed item 3. Overall, the 442 naive Amsterdam students do not perform worse than the other groups.
 These results should be cause for concern: researchers who interpret and use confidence intervals in their scientific work appear to have little (if any) idea of what a confidence interval really is. Personally this worries me a great deal, but I can’t fault the researchers. They took the same kind of statistics courses as I did, and probably found them just as boring. If statisticians and methodologists want researchers to understand confidence intervals, then they should start teaching the foundations of statistics, including what a confidence interval really means, why you would want to compute it at all, and why it may be best to do away with the frequentist framework altogether. Doing away with the frequentist framework will facilitate more sensible statistics, a statistics that connects more closely to what researchers want to know. I am more than 95% confident that this claim is correct.
Relevant Publications and Links
Berger, J. O., & Wolpert, R. L. (1988). The likelihood principle (2nd ed.). Hayward, CA: Institute of Mathematical Statistics. Freely available at http://projecteuclid.org/.
Cumming, G. (2014). The new statistics: Why and how. Psychological Science, 25, 17-29.
Hoekstra, R., Morey, R. D., Rouder, J. N., & Wagenmakers, E.-J. (in press). Robust misinterpretation of confidence intervals. Psychonomic Bulletin & Review.
Wagenmakers, E.-J. (2007). A practical solution to the pervasive problems of p values. Psychonomic Bulletin & Review, 14, 779-804.


Eric-Jan, I think the current debates about statistics are quite interesting, but there’s one thing I’m not sure about here. Are you arguing that the frequentist framework is inherently flawed, or are you arguing that the problem with the frequentist framework is that it is so frequently misunderstood (or mis-taught)?
Eric: yes, I believe the frequentist framework is inherently flawed. Chapter 2 in the Berger & Wolpert book provides a great overview. If statistics weren’t taught so badly, students would be aware of these flaws.
Cheers,
E.J.
Eric-Jan: thanks. One follow-up question then: will Bayesian statistics actually be easier to teach correctly, and will they be easier to understand for our students (and for researchers trained in the frequentist framework)? I know very little about Bayesian statistics, but (perhaps for that very reason) I have always had the impression that they are a bit more complicated than our current statistical conventions, both conceptually and computationally.
As a student I am really confused by the statements about bayesian statistics.
“we do not like the frequencist’s approach, you should study it… Also, there is bayesian statistics, which is great, but to you fellow student, it will remain magic”
Why are we not taught bayesian statistics at all?
Hi Immo, Bayesian statistics is typically offered at the graduate level due to it being considered more specialized. There is a paucity of educational material geared towards non-mathematics savvy students, so it is naturally harder to teach for that reason. In coming years, this will be less of a problem.
However, a bigger problem is that you can’t *really* just stick a few extra lectures into your typical statistics course and add Bayesian content. Curricula are typically already too packed with material already, and this would just confuse students. Courses — entire course sequences, even — would have to be redesigned from the ground up to present the information students need in a non-confusing way. This is a big undertaking. We’ve got some ideas along those lines, though. Hopefully they will bear fruit.
Hi Eric. Conceptually, Bayesian inference is straightforward and intuitive; Laplace called it “common sense expressed in numbers”. The biggest problem is that few Bayesian statisticians have bothered to make their work accessible to the masses; and, just as with any other topic, you can make it as complicated as you like. Together with Michael Lee, I’ve written a book about Bayesian statistics that I hope is not too difficult. Check out http://www.bayesmodels.com (the first two parts are freely available). Cheers, E.J.
Thanks Eric-Jan, I’ll check that out, and who knows, I might even be converted. 😉
I wonder what it would have been like if there had been a third option, which was “I don’t know/understand enough to answer this”. It would have been interesting to allow researchers to be honest about their lack of statistical knowledge rather than potentially making guesses on true false statement.
In my experience researchers are often willing to discuss how under prepared they feel at times when confronted with statistics, at least amongst their peers (who knows in terms of a survey, but it would have been interesting) – and seek out statistical support when needed (and if their ego allows it). However, getting support can be difficult in terms of not knowing who to ask or finding someone who does understand and isn’t too busy (or that you feel too polite to interrupt).
I am glad to see the teaching of statistics called out here as an issue, it certainly is. It is also the case of how infrequently the knowledge learned needs to be applied that causes erosion of understanding. Personally, I got great marks in my statistic courses during undergrad, then when I started doing research I only had to use one or two of the concepts taught, and the others just started to fade away – causing issues later when I had to struggle to recall what I had been taught, but never really applied outside of exams, when it did become relevant later (or worse, maybe I have forgotten stuff that may have been relevant but I never knew that it was!). A difficult problem to solve!